Performance Best Practices#
Here we gather a few tricks and advice for improving CuPy’s performance.
Benchmarking#
It is utterly important to first identify the performance bottleneck before making any attempt to optimize
your code. To help set up a baseline benchmark, CuPy provides a useful utility cupyx.profiler.benchmark()
for timing the elapsed time of a Python function on both CPU and GPU:
>>> from cupyx.profiler import benchmark
>>>
>>> def my_func(a):
...     return cp.sqrt(cp.sum(a**2, axis=-1))
...
>>> a = cp.random.random((256, 1024))
>>> print(benchmark(my_func, (a,), n_repeat=20))
my_func             :    CPU:   44.407 us   +/- 2.428 (min:   42.516 / max:   53.098) us     GPU-0:  181.565 us   +/- 1.853 (min:  180.288 / max:  188.608) us
For users working in IPython or Jupyter notebooks, CuPy provides a convenient %gpu_timeit magic that wraps cupyx.profiler.benchmark().
First load the extension, then use it as either a line or cell magic:
In [1]: %load_ext cupyx.profiler

In [2]: import cupy as cp

In [3]: %gpu_timeit cp.arange(1000).sum()
run                 :    CPU:    49.439 us   +/-  1.875 (min:    47.769 / max:    95.190) us     GPU-0:    53.416 us   +/-  1.966 (min:    51.200 / max:    99.328) us

In [4]: %%gpu_timeit
   ...: x = cp.random.random((1000, 1000))
   ...: y = x @ x.T
   ...:
   ...:
run                 :    CPU:    76.095 us   +/-  3.544 (min:    72.168 / max:   140.140) us     GPU-0:  1615.272 us   +/- 19.859 (min:  1605.536 / max:  1818.624) us
The magic accepts the same options as cupyx.profiler.benchmark() (-n/--n-repeat, -w/--n-warmup, --max-duration).
Because GPU executions run asynchronously with respect to CPU executions, a common pitfall in GPU programming is to mistakenly
measure the elapsed time using CPU timing utilities (such as time.perf_counter() from the Python Standard Library
or the %timeit magic from IPython), which have no knowledge in the GPU runtime. cupyx.profiler.benchmark() and %gpu_timeit address
this by setting up CUDA events on the Current Stream right before and after the function to be measured and
synchronizing over the end event (see Streams and Events for detail). Below we sketch what is done internally in cupyx.profiler.benchmark():
>>> import time
>>> start_gpu = cp.cuda.Event()
>>> end_gpu = cp.cuda.Event()
>>>
>>> start_gpu.record()
>>> start_cpu = time.perf_counter()
>>> out = my_func(a)
>>> end_cpu = time.perf_counter()
>>> end_gpu.record()
>>> end_gpu.synchronize()
>>> t_gpu = cp.cuda.get_elapsed_time(start_gpu, end_gpu)
>>> t_cpu = end_cpu - start_cpu
Additionally, cupyx.profiler.benchmark() and %gpu_timeit/%%gpu_timeit run a few warm-up runs to reduce timing fluctuation and exclude the overhead in first invocations.
One-Time Overheads#
Be aware of these overheads when benchmarking CuPy code.
Context Initialization#
It may take several seconds when calling a CuPy function for the first time in a process. This is because the CUDA driver creates a CUDA context during the first CUDA API call in CUDA applications.
Kernel Compilation#
CuPy uses on-the-fly kernel synthesis. When a kernel call is required, it compiles a kernel code optimized for the dimensions and dtypes of the given arguments, sends them to the GPU device, and executes the kernel.
CuPy caches the kernel code sent to GPU device within the process, which reduces the kernel compilation time on further calls.
The compiled code is also cached in the directory ${HOME}/.cupy/kernel_cache (the path can be overwritten by setting the CUPY_CACHE_DIR environment variable).
This allows reusing the compiled kernel binary across the process.
Testing with CI/CD#
When running CI/CD to test CuPy or any downstream packages that heavily rely on CuPy, depending on the use cases the developers/users may find that JIT compilation takes a non-negligible amount of time. To accelerate testing, it is advised to store the artifacts generated under the cache directory (see the above section) in a persistent location (say, a cloud storage) after the test is finished, regardless of success or failure, so that the artifacts can be re-used across runs, avoiding JIT’ing kernels at test time.
In-depth profiling#
To mark with NVTX/rocTX ranges, you can use the cupyx.profiler.time_range() API. To start/stop the profiler, you can use the cupyx.profiler.profile() API.
Profiling kernels with Nsight Compute#
When profiling CuPy kernels (whether they are part of the CuPy codebase or user-provided kernels including
RawKernel, RawModule, ElementwiseKernel, etc.),
it is often useful to correlate the source code with performance metrics in tools like NVIDIA Nsight Compute.
This allows you to analyze which lines translate to which instructions and see the time each one takes.
The trick is to leverage CuPy’s ability to dump kernel source code to disk (by setting the environment variable CUPY_CACHE_SAVE_CUDA_SOURCE to 1) and then load it into the profiler.
Steps#
Taking the script below as an example, we would like to profile the kernel named
my_kernel:# profiling_example.py import cupy as cp code = r""" extern "C" __global__ void my_kernel(int n) { if (threadIdx.x < n) { printf("I am called!\n"); } } """ mod = cp.RawModule(code=code, options=("-std=c++17", '-lineinfo')) mod.compile() ker = mod.get_function("my_kernel") ker((1,), (4,), (16,))
Note that
-lineinfois passed in the compile options, which is essential for source-level profiling.Run Nsight Compute with the
CUPY_CACHE_SAVE_CUDA_SOURCEenvironment variable set:$ CUPY_CACHE_SAVE_CUDA_SOURCE=1 ncu -f -o profiling_example --set full --import-source 1 -k regex:my_kernel python profiling_example.py
Replace
profiling_example.pywith the name of your script, and adjust the kernel name filter (-k regex:my_kernel) to match your kernel’s name. If no filter is provided, ncu defaults to profile all kernels run in the program, which may or may not be desired.When running
ncuwith--import-source 1, it may raise a warning like this:... .100% - 43 passes ==PROF== Disconnected from process 369409 ==WARNING== Failed to import the following source files: ==WARNING== /tmp/tmp98lg4lk7/f7bef1b6674b73caa772af4714fa4d2213dd2897.cubin.cu ==PROF== Report: /path/to/profiling_example.ncu-rep
but as long as
-lineinfois passed at compile time, the counter data will be available. We just need to load the source code dumped by CuPy.Verify that the source file is cached in the CuPy cache directory:
$ ls -l $CUPY_CACHE_DIR/*.cu
If
CUPY_CACHE_DIRis not set, the default location is typically~/.cupy/kernel_cache. You should see a.cufile corresponding to your kernel. If not, you may need to clear the cached files under the cache directory and retry Step 2.If profiling remotely, make sure to transfer both the Nsight Compute output (
profiling_example.ncu-repfor the above example) and the dumped source code in$CUPY_CACHE_DIRback to your local machine.Load the Nsight Compute output in the GUI. When switching to the “Source” tab, it may show that the source code is not found. Click “Resolve” and navigate to the CuPy cache directory to load the corresponding
.cufile. Once loaded, you can see resource usage correlated with line numbers: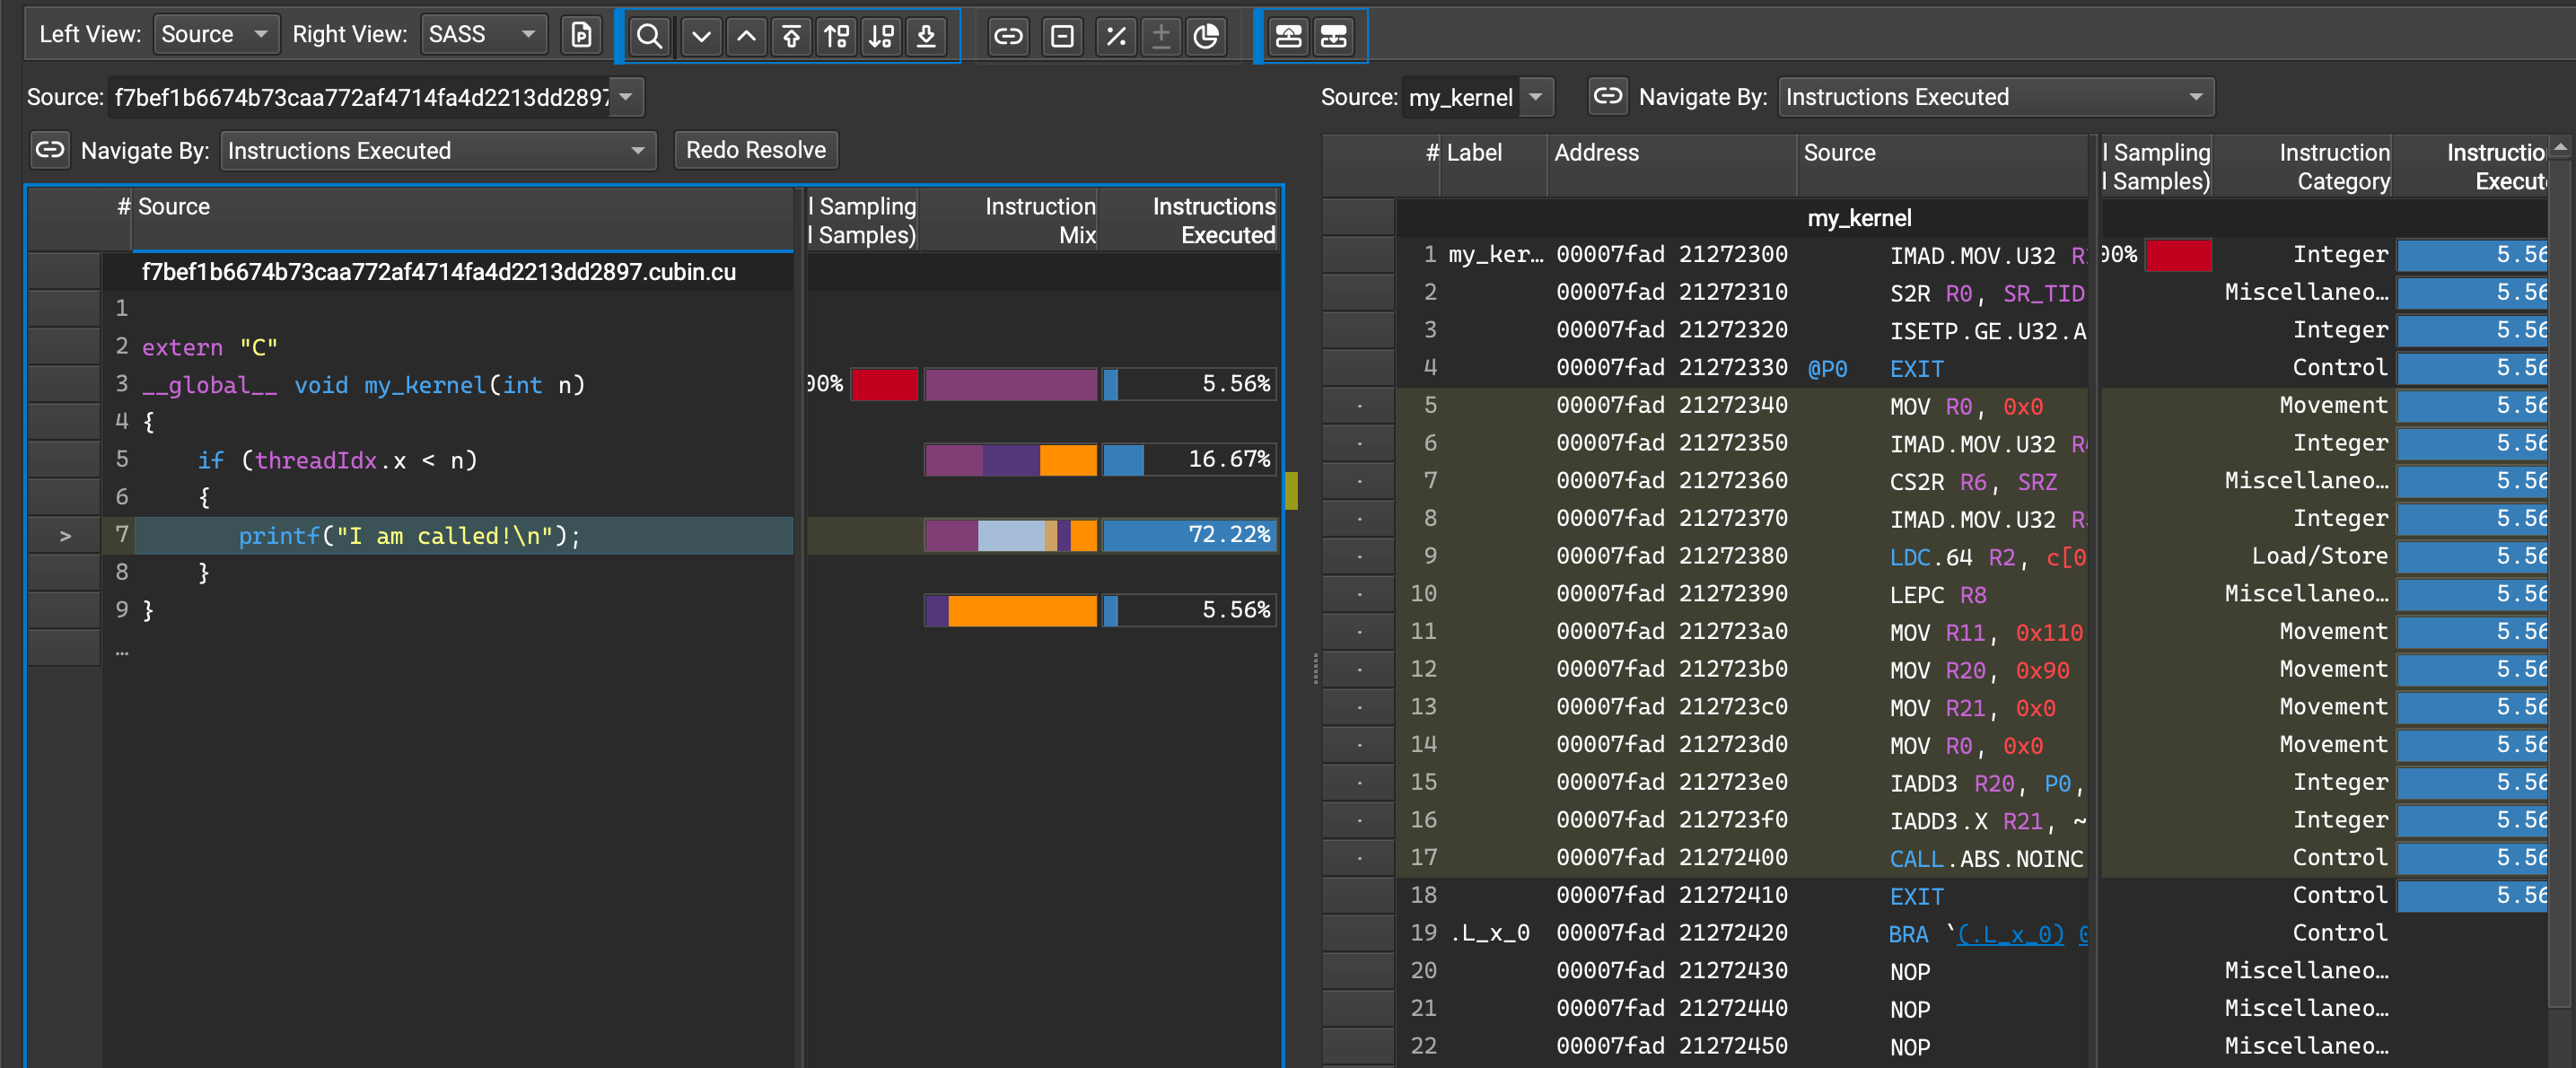
This approach works for any kernel compiled through CuPy’s machinery, including ElementwiseKernel,
ReductionKernel, rawkernel(), and other user-defined kernels.
Use CUB/cuTENSOR backends for reduction and other routines#
For reduction operations (such as sum(), prod(), amin(), amax(), argmin(), argmax()) and many more routines built upon them, CuPy ships with our own implementations so that things just work out of the box. However, there are dedicated efforts to further accelerate these routines, such as CUB and cuTENSOR.
In order to support more performant backends wherever applicable, starting v8 CuPy introduces an environment variable CUPY_ACCELERATORS to allow users to specify the desired backends (and in what order they are tried). For example, consider summing over a 256-cubic array:
>>> from cupyx.profiler import benchmark
>>> a = cp.random.random((256, 256, 256), dtype=cp.float32)
>>> print(benchmark(a.sum, (), n_repeat=100))
sum                 :    CPU:   12.101 us   +/- 0.694 (min:   11.081 / max:   17.649) us     GPU-0:10174.898 us   +/-180.551 (min:10084.576 / max:10595.936) us
We can see that it takes about 10 ms to run (on this GPU). However, if we launch the Python session using CUPY_ACCELERATORS=cub python, we get a ~100x speedup for free (only ~0.1 ms):
>>> print(benchmark(a.sum, (), n_repeat=100))
sum                 :    CPU:   20.569 us   +/- 5.418 (min:   13.400 / max:   28.439) us     GPU-0:  114.740 us   +/- 4.130 (min:  108.832 / max:  122.752) us
CUB is a backend shipped together with CuPy.
It also accelerates other routines, such as inclusive scans (ex: cumsum()), histograms,
sparse matrix-vector multiplications (not applicable in CUDA 11), and ReductionKernel.
cuTENSOR offers optimized performance for binary elementwise ufuncs, reduction and tensor contraction.
If cuTENSOR is installed, setting CUPY_ACCELERATORS=cub,cutensor, for example, would try CUB first and fall back to cuTENSOR if CUB does not provide the needed support. In the case that both backends are not applicable, it falls back to CuPy’s default implementation.
Note that while in general the accelerated reductions are faster, there could be exceptions depending on the data layout. In particular, the CUB reduction only supports reduction over contiguous axes. In any case, we recommend to perform some benchmarks to determine whether CUB/cuTENSOR offers better performance or not.
Note
CuPy v11 and above uses CUB by default. To turn it off, you need to explicitly specify the environment variable CUPY_ACCELERATORS="".
Overlapping work using streams#
Under construction.
Use JIT compiler#
Under construction. For now please refer to JIT kernel definition for a quick introduction.
Prefer float32 over float64#
Under construction.